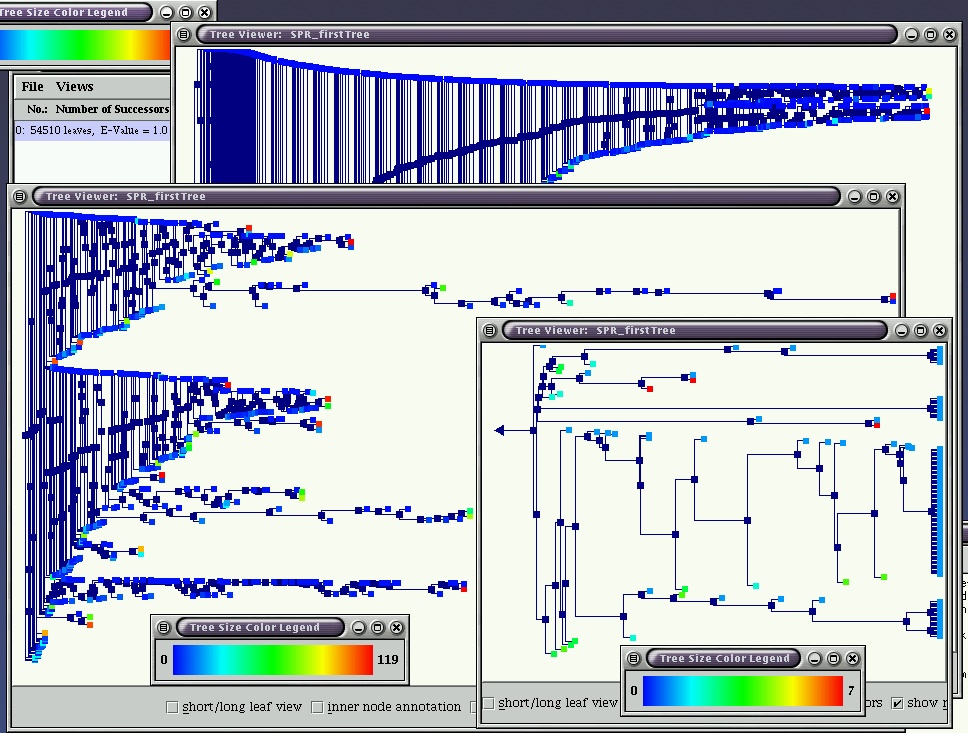
The first of the following two pictures shows the biggest subcomponent of the SYSTERS protein tree
(created by a linkage clustering algorithm using e-values as distance measure)
with 50 000 leaf nodes in a restricted view and some subtrees of it.
The restricted view preserves the structure of the tree while suppressing
the details, i.e. the leaf nodes that do not fit onto the screen. The colors of
the clusters represented by rectangles correspond with the colors of the subtrees.
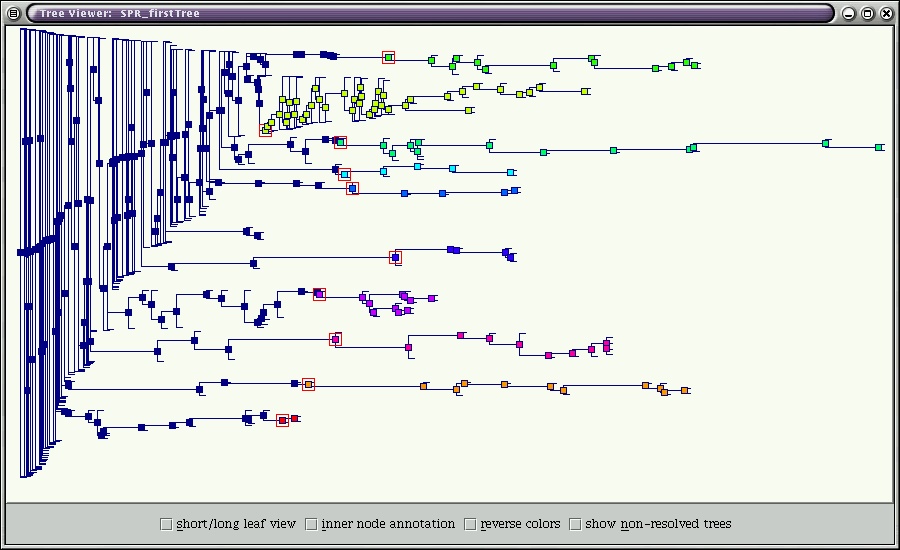
The following two pictures show a subtree of the SYSTERS tree where
some subtrees are marked in different colors. The proteins which
form the leaf nodes of those subtrees are used to define clusters
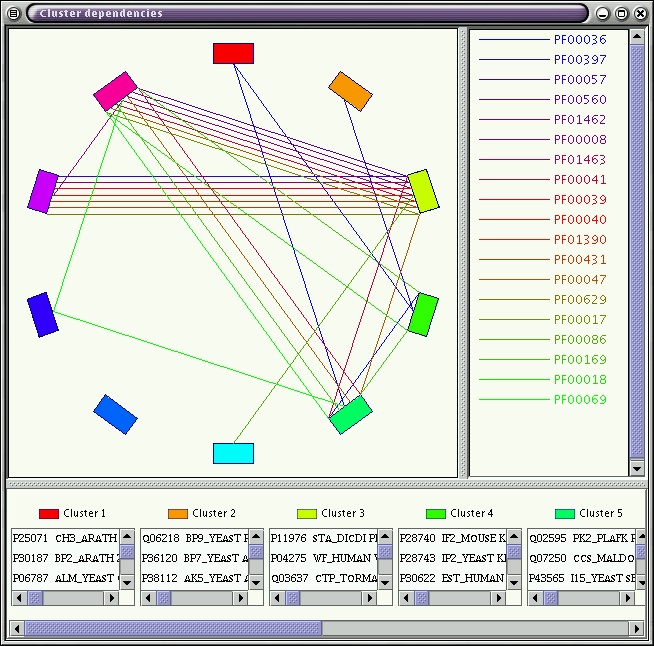
of proteins which are shown in the window below the tree image.
Each of the colored lines between two clusters denotes a relationsship
between the clusters which consists of a domain which appears
in at least one protein in each of the two clusters.